

What is this website?
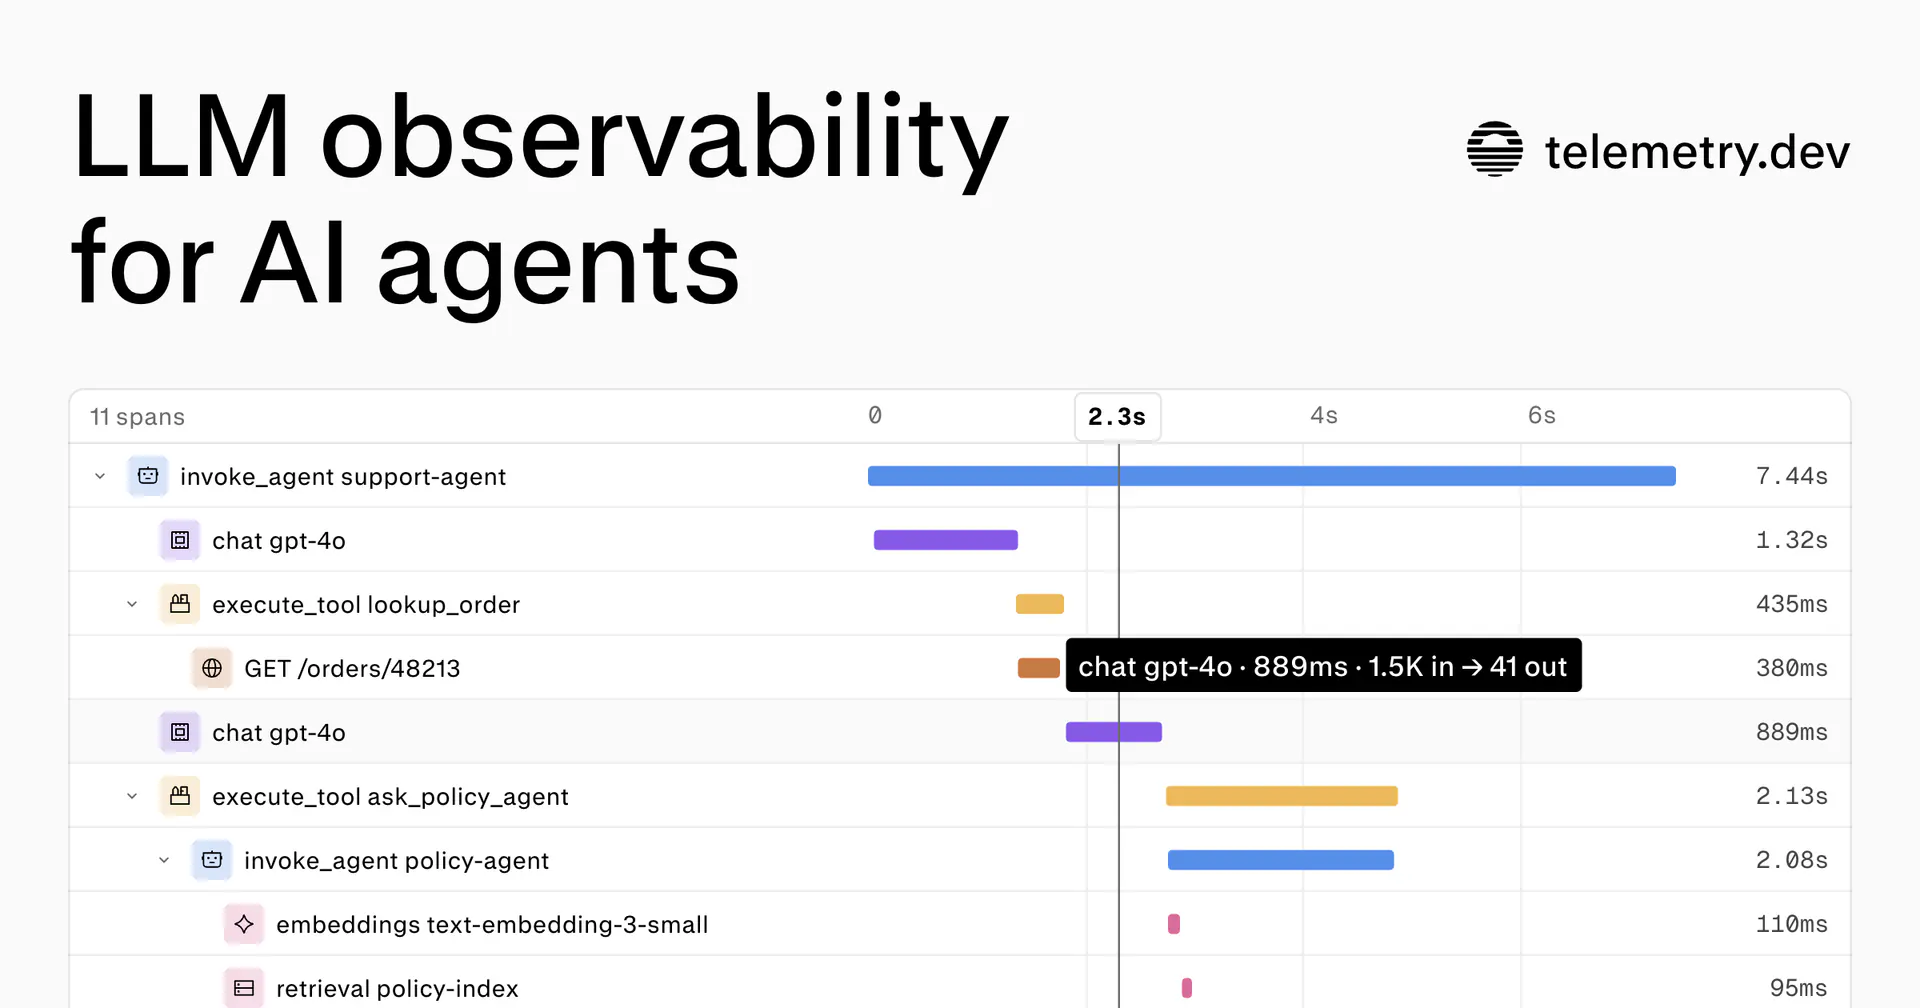
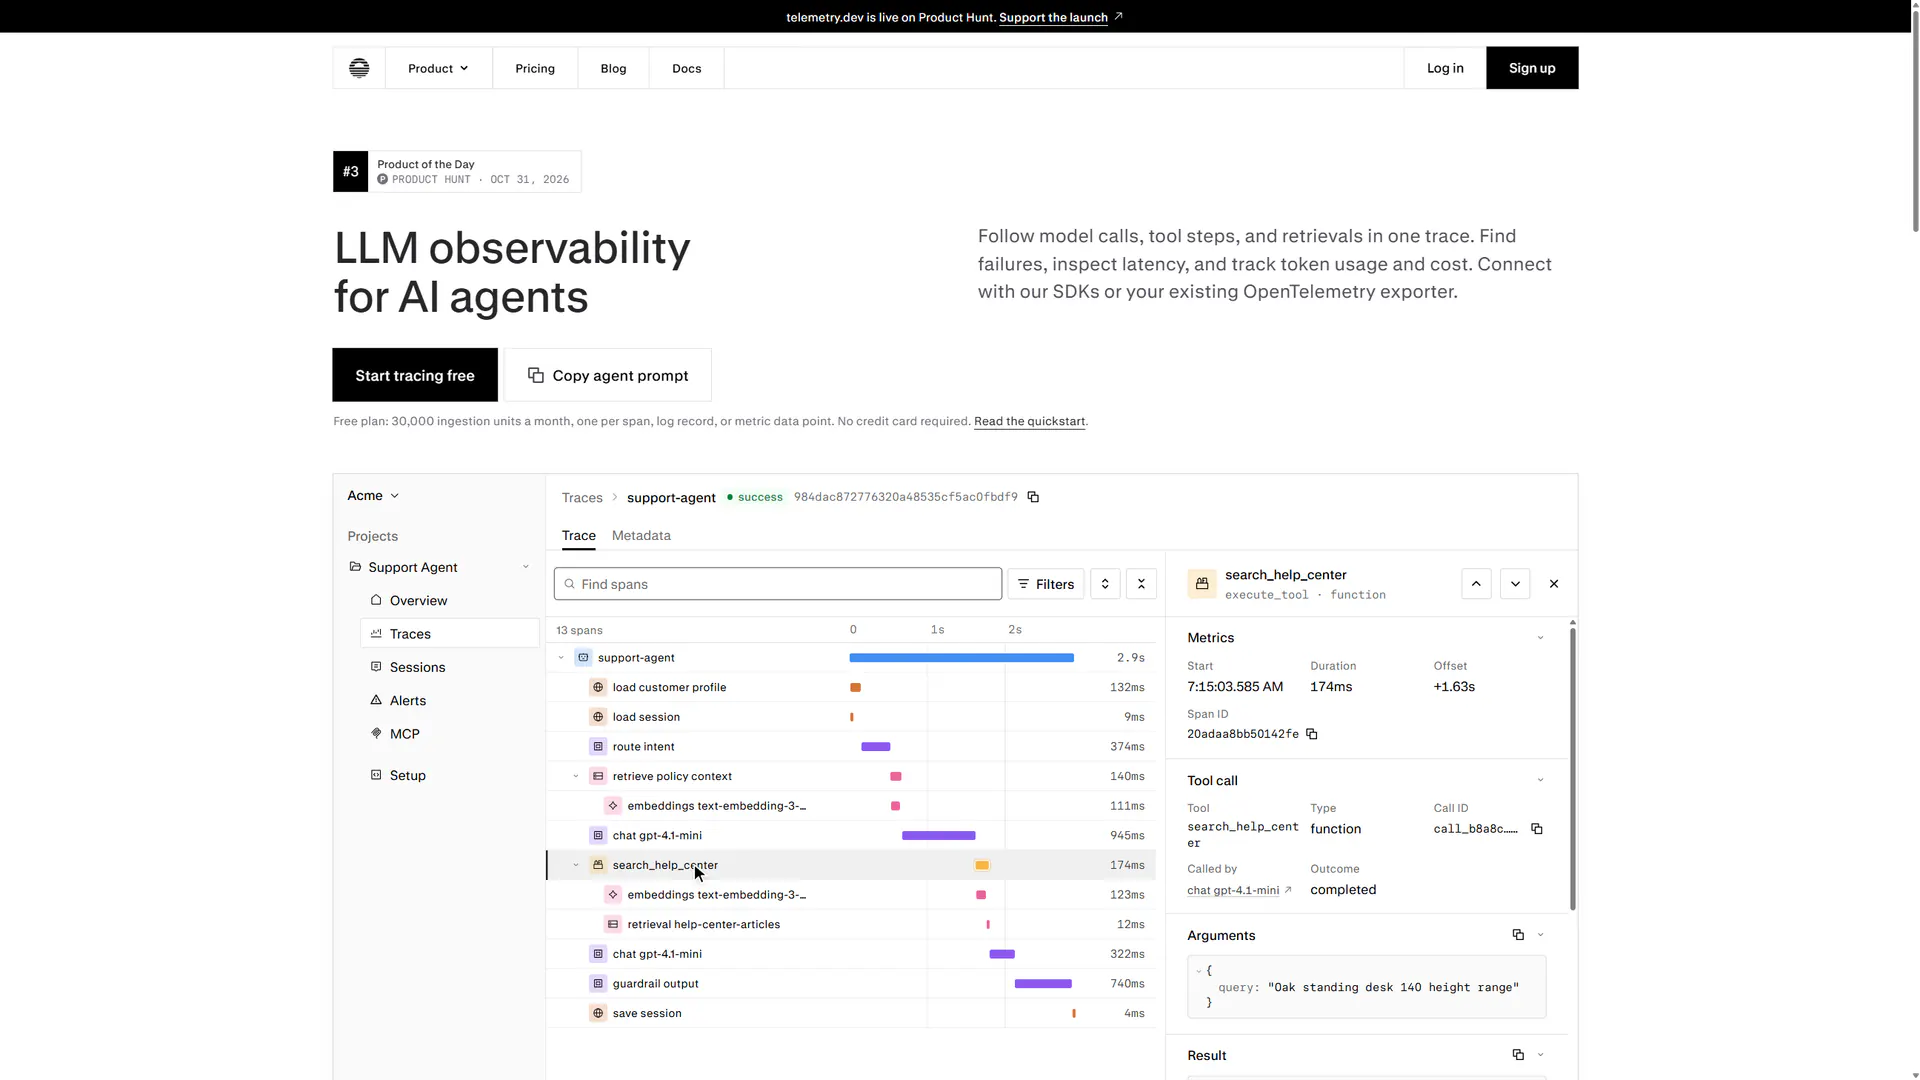
telemetry.dev is a browser product for inspecting AI applications and agents. Model calls, tool steps, and retrievals in one request become one trace, with duration, tokens, estimated cost, and errors. Connect a TypeScript or Python SDK, or point an existing OTLP/HTTP exporter here. It fits teams that need to find failures and spend. Requests that were never instrumented do not appear.
Key Features
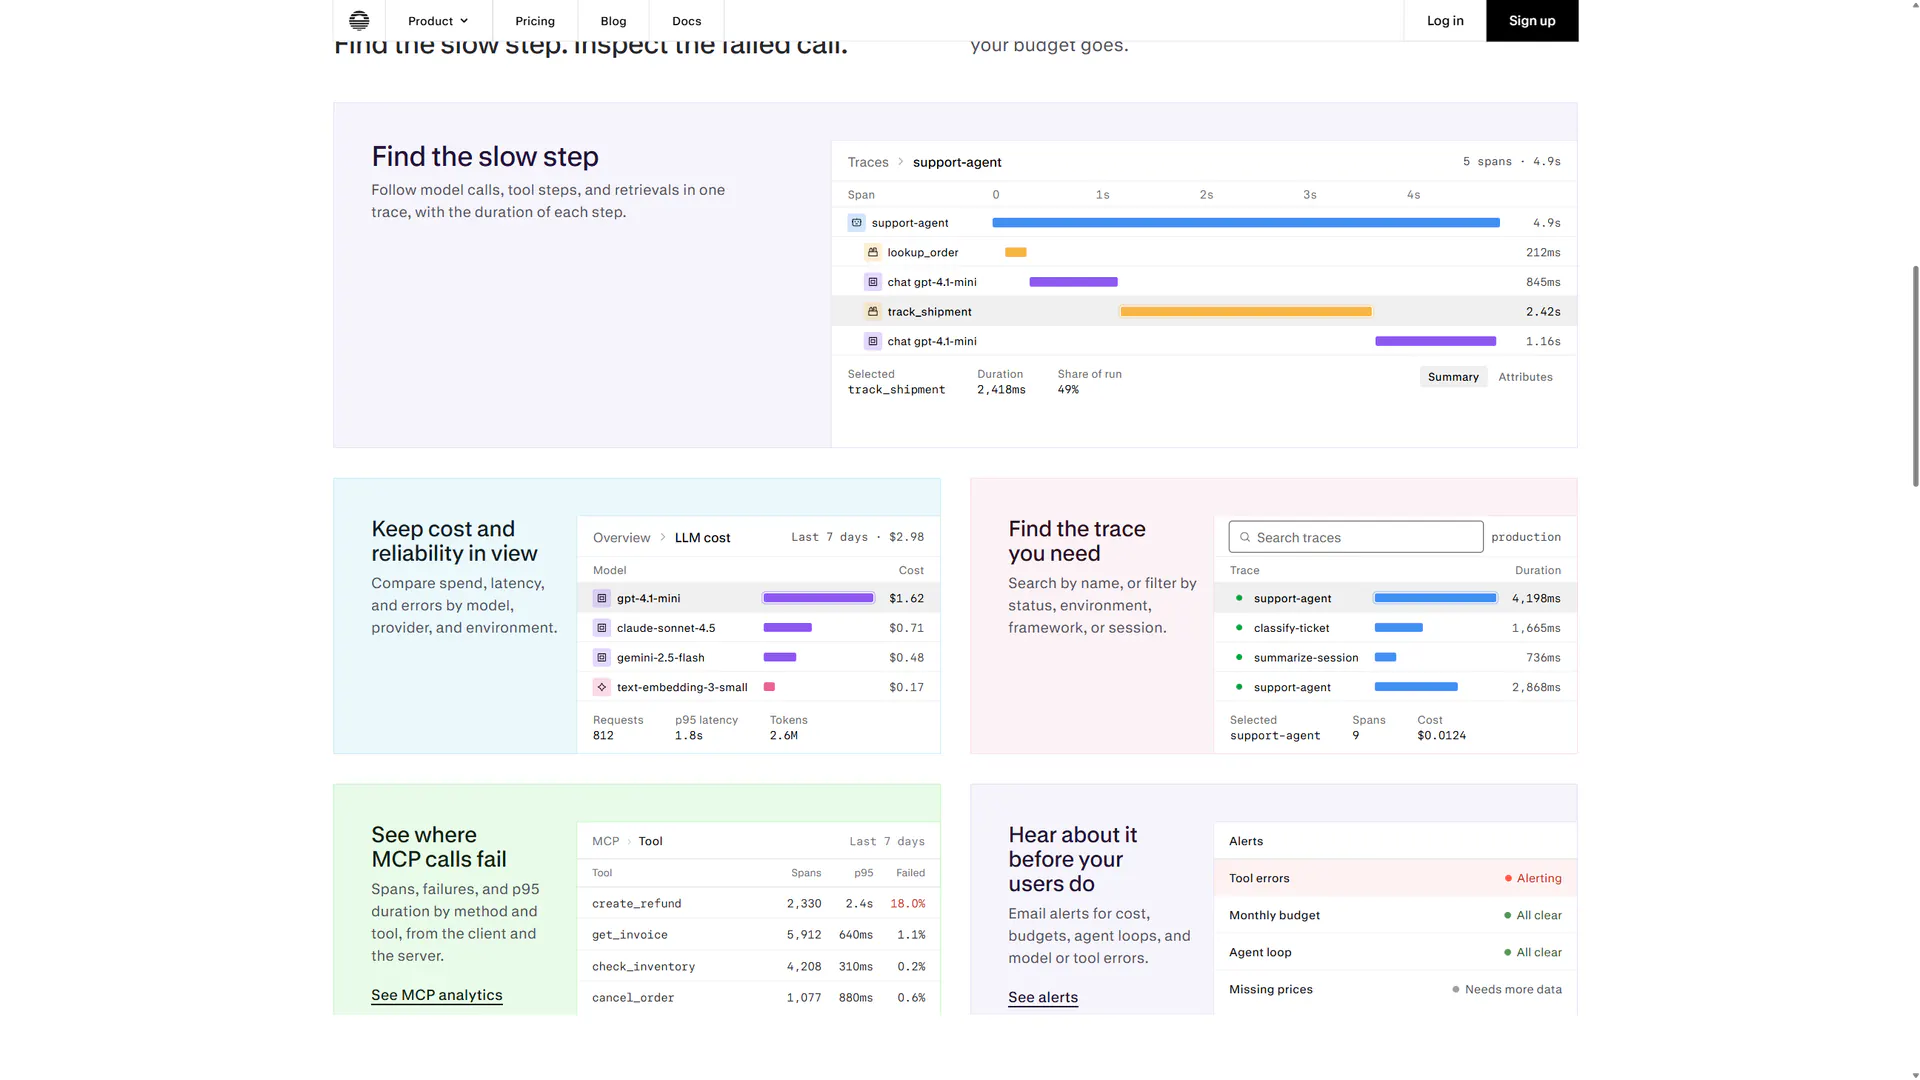
- Expand model calls, tool steps, and retrievals into one trace, with the duration of each step.
- Compare token cost, latency, and errors by model, provider, and environment.
- Summarize MCP methods and tools by span count, failure rate, and p95 duration.
- Send email when cost, budgets, agent loops, or model and tool errors move away from their usual range.
- Change prompt versions and labels without a deploy, and record cost and errors for each eval run.
Common Use Cases
- When a support agent slows down, a backend developer opens the trace to see a tool timeout or a long model call.
- Someone watching budget checks estimated spend by model, and whether cache reads and writes use separate rates.
- A platform team points existing OTLP/HTTP export at telemetry.dev instead of writing another client for every language.
- A security owner disables prompt and response storage per environment so conversations are not kept by default.
Who is it for?
- Teams building LLM applications with TypeScript, Python, or OTLP who need the call chain for a single request.
- People who want token cost, latency, and errors in one place, rather than only application logs.
- People who have not instrumented the app and do not plan to use OpenTelemetry will not see calls just by opening the site.
- People who only want a chat window to try a model will not find an end-user chat product here.
How does it compare with similar tools?
- If you already use OpenTelemetry, check whether the exporter can send OTLP/HTTP here. The Python and TypeScript SDKs are another path, not the only one.
- If you want the free allowance for one real request first, Free includes 30,000 ingestion units a month and 14-day retention. Compare Pro and Team retention and seats after volume grows.
- If keeping conversations out of storage matters more, prompt capture can be turned off per environment. The site also says this does not stop text already written into logs, errors, or custom attributes.
Pricing Details
Prices are per workspace, per month, from https://telemetry.dev/pricing. Amounts and durations in the homepage demo are interface samples, not plan prices.
- Free: $0, no credit card. 30,000 ingestion units a month, 14-day retention, 1 project, and 2 seats. One unit is one normalized span, one OTLP log record, or one metric data point. A request is rejected if accepting it would push the month above 36,000.
- Pro: $25 per month. 500,000 units, 30-day retention, 5 projects, and 5 seats. Ingestion continues above the allowance, with no automatic overage charge.
- Team: $50 per month. 2 million units, 90-day retention, unlimited projects and seats, plus priority support. Usage above the allowance is handled the same way as Pro.
- Usage resets at 00:00 UTC on the first day of each month, separate from the billing date. The pricing FAQ says you can upgrade, downgrade, or cancel at any time, with no contract and no cancellation penalty.
FAQ
Q: Does the free plan require a credit card?
A: No. The pricing page says Free is $0 and includes 30,000 units a month, 14-day retention, one project, and two seats.
Q: Where do the costs on the page come from?
A: At ingest, cost is calculated from reported token usage and the model price list. Cache reads and cache writes are priced separately when those rates exist. If the price or token usage does not match, no cost is shown.
Q: Can prompts and model replies be left out of storage?
A: Yes, per environment, before they are stored. The site says this does not stop the content from being sent to ingest first, and it does not clear arbitrary text in logs, errors, or custom attributes.
Q: Can only TypeScript and Python connect?
A: No. Those two have official SDKs. Other languages can send standard OTLP/HTTP. Which fields appear in a trace depends on what the instrumentation actually emits.
Why We Recommend?
Model calls, tools, and retrievals from one agent run sit on the same trace, so duration and estimated cost can be read together. Teams that already have TypeScript, Python, or an OTLP pipeline can look at a real request on the free allowance. The app has to emit spans first, and the free tier keeps only 14 days and 30,000 units a month.
Sources
- Pages: https://telemetry.dev/ , https://telemetry.dev/pricing , https://telemetry.dev/features
- Last checked: 2026-11-02
- Note: Prices, allowances, and integrations follow the current official pages. Homepage sample figures are not customer usage or plan prices.


